Prometheus Overview
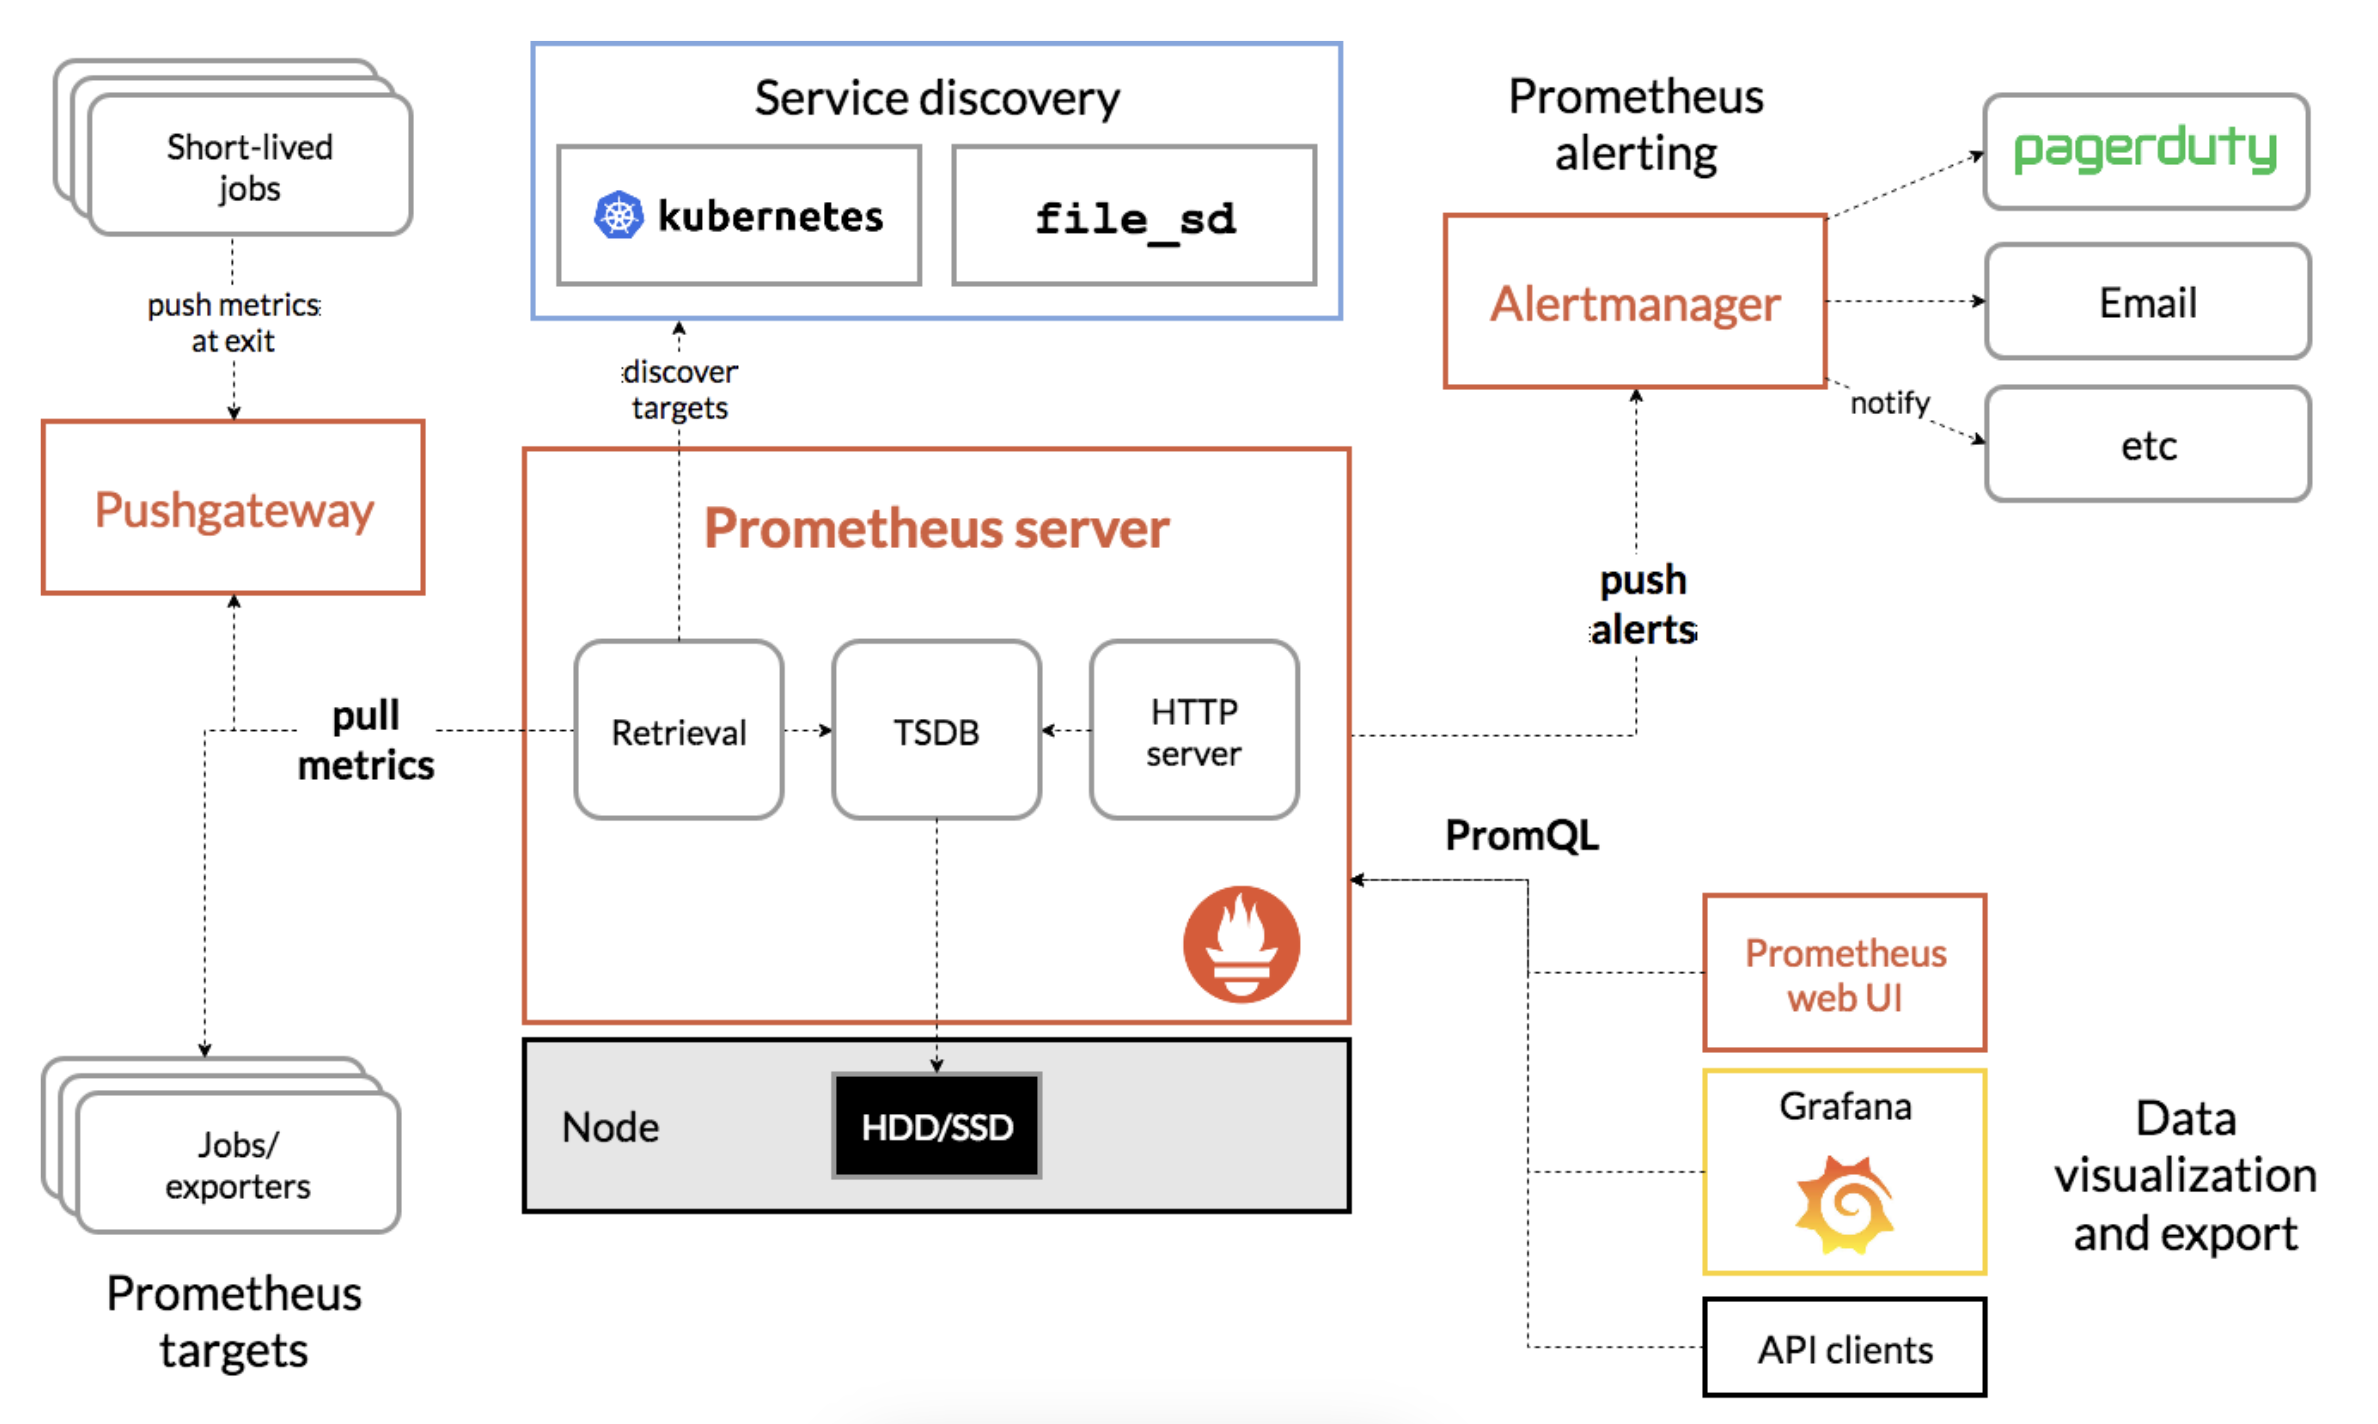
Architecture#
Quick Start#
Data Model#
Every time series is uniquely identified by its metric name and optional key-value pairs called labels.
- Metric Name
- Metric Label
- The change of any labels value, including adding or removing labels, will create a new time series.
Metric Type#
Prometheus supports four types of metrics, which are - Counter - Gauge - Histogram - Summary
- Counter: a metric value that can only increase or reset
# use a counter to represent the number of requests served, tasks completed, or errors - http_requests_total{handler='/get_user_id', method='GET', status='200'} - errors_total{type='runtime', severity='critical'} - Gauge: a number which can either go up or down
# used for measured values like temperatures or current memory usage - memory_usage_bytes{process_name='web_server', instance='10.0.0.1:8080'} - queue_size{queue_name='low_priority', worker_type='background'} - Histogram: used for any calculated value which is counted based on bucket values,
- bucket value determines the ordinate value (y coordinate of a standard two-dimensional graph)
- cumulative counters for the observation buckets, exposed as _bucket{le="<upper inclusive bound>"}
# usually things like request durations or response sizes # le="0.3" means less or equal to 0.3 http_latency_sum 134420.14452212452 http_latency_second_bucket{le="0.05"} 11326.0 http_latency_second_bucket{le="0.1"} 2.284831e+06 http_latency_second_bucket{le="0.15"} 2.285367e+06 http_latency_second_bucket{le="0.25"} 2.285592e+06 http_latency_second_bucket{le="1.0"} 2.285613e+06 http_latency_second_bucket{le="+Inf"} 2.285619e+06 http_latency_count 2.285619e+06 # cumulative means that the count for le=”0.5” bucket also includes the count for le=”0.25” bucket. # Consider the following hypothetical distribution of observations for 200 observations. ┌─────────────┬──────────────────────┬──────────────────┐ │ Bucket Size │ Cumulative Frequency │ Upper Bound │ │ │ Count │ Percentile │ ├─────────────┼──────────────────────┼──────────────────┤ │ 50ms │ 20 │ p10 │ │ 100ms │ 70 │ p35 │ │ 250ms │ 120 │ p60 │ │ 500ms │ 150 │ p75 │ │ 1000ms │ 200 │ p100 │ │ INF │ 200 │ p100 │ └─────────────┴──────────────────────┴──────────────────┘ - Summary: measure events and are an alternative to histograms. They are cheaper but lose more data (it is highly recommended to use histograms over summaries whenever possible.)
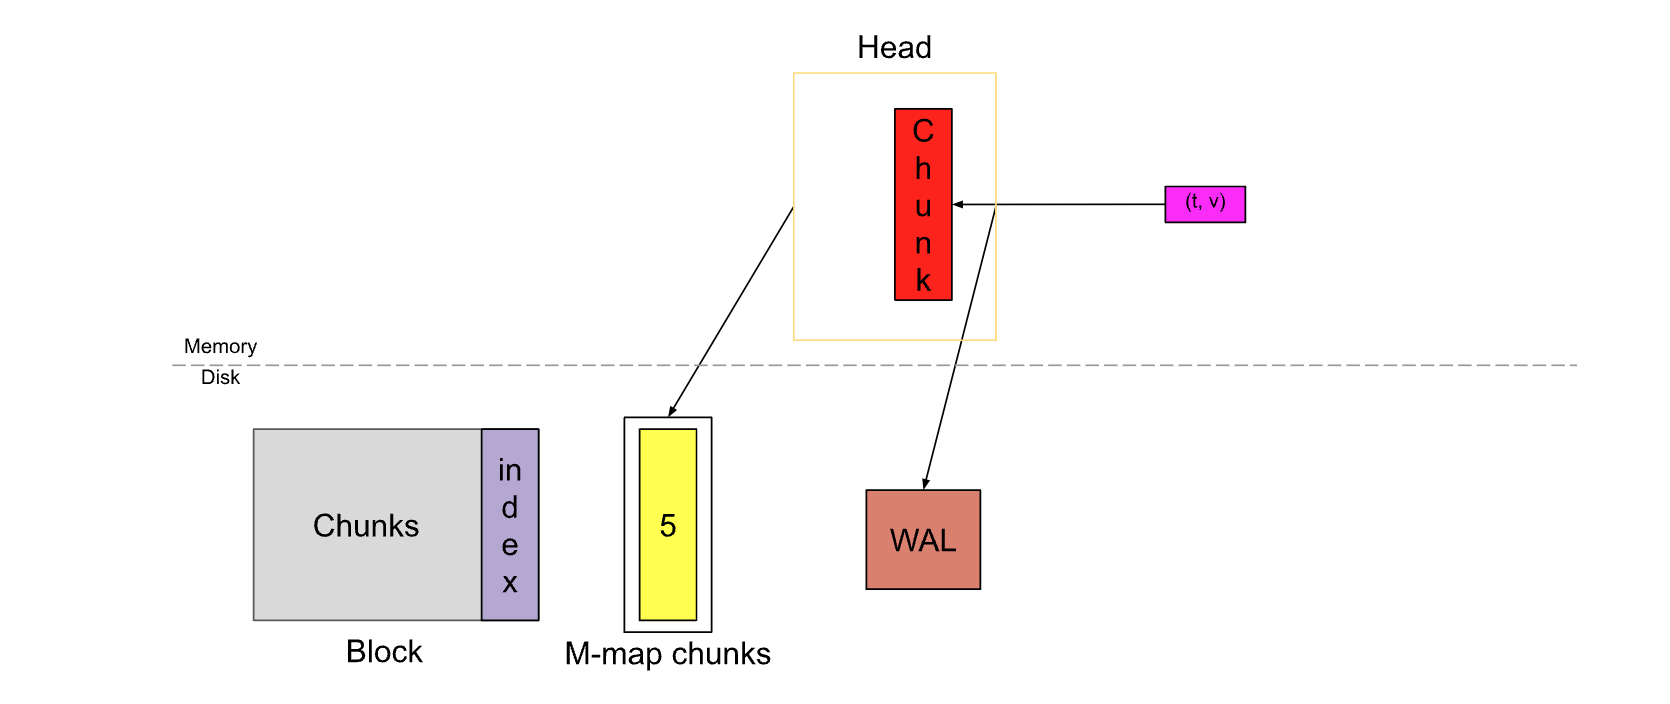
Storage#
./data
├── 01BKGV7JBM69T2G1BGBGM6KB12
│   └── meta.json
├── 01BKGTZQ1SYQJTR4PB43C8PD98
│   ├── chunks
│   │   └── 000001
│   ├── tombstones
│   ├── index
│   └── meta.json
├── 01BKGTZQ1HHWHV8FBJXW1Y3W0K
│   └── meta.json
├── 01BKGV7JC0RY8A6MACW02A2PJD
│   ├── chunks
│   │   └── 000001
│   ├── tombstones
│   ├── index
│   └── meta.json
├── chunks_head
│   └── 000001
└── wal
    ├── 000000002
    └── checkpoint.00000001
        └── 00000000
see detals, simple put:
blocks: ingested samples are grouped into blocks of 2 hours, e.g. 01BKGV7JBM69T2G1BGBGM6KB12 is a blockchunks:- it’s a directory that contains the time series data for that window of time (up to 2 hours)
- The samples in the chunks directory are grouped together into one or more segment files of up to 512MB each by default
tombstones: marked deletion records (instead of deleting the data immediately from the chunk segments)index: inverted index which indexes metric names and labels to time series in the chunks directorymeta.json: block infowal(write-ahead log):- The current block for incoming samples is kept in memory and is not fully persisted. It is secured against crashes by a write-ahead log (WAL) that can be replayed when the Prometheus server restarts.
- files are stored in the wal directory in 128MB segments, which are significantly larger than regular block files (not yet been compacted)
- minimum of 3 write-ahead log files. High-traffic servers may retain more than 3 WAL files in order to keep at least 2 hours of raw data.
PromQL#
Time series Selectors#
Instant Vector
Instant vector selectors allow the selection of a set of time series and a single sample value for each at a given timestamp (instant)
# only metric name
http_requests_total

# with labels
http_requests_total{job="prometheus",group="canary"}

# with regex
http_requests_total{environment=~"staging|testing|development",method!="GET"}
Range Vector Selectors
Range vector literals work like instant vector literals, except that they select a range of samples back from the current instant
http_requests_total{job="prometheus"}[5m]
Offset Modifier
The offset modifier allows changing the time offset for individual instant and range vectors in a query.
# returns the 5-minute rate that http_requests_total had a week ago
rate(http_requests_total[5m] offset 1w)
Functions#
There are some common functions in PromQL which are used in most popular queries and scenarios.
1. rate() && irate()#
2. histogram_quantile()#
How P99 is calculated?
Reference#
- https://prometheus.io/docs/introduction/overview/
- https://prometheus.io/docs/prometheus/latest/querying/basics/
- https://promlabs.com/blog/2023/08/31/high-availability-for-prometheus-and-alertmanager-an-overview/
- PromCon 2016 - The Prometheus TSDB Slides
- The Evolution of Prometheus Storage Layer
- Prometheus TSDB
- Writing a Time Series Database from Scratch
- Write a time-series database engine from scratch (hancker news)